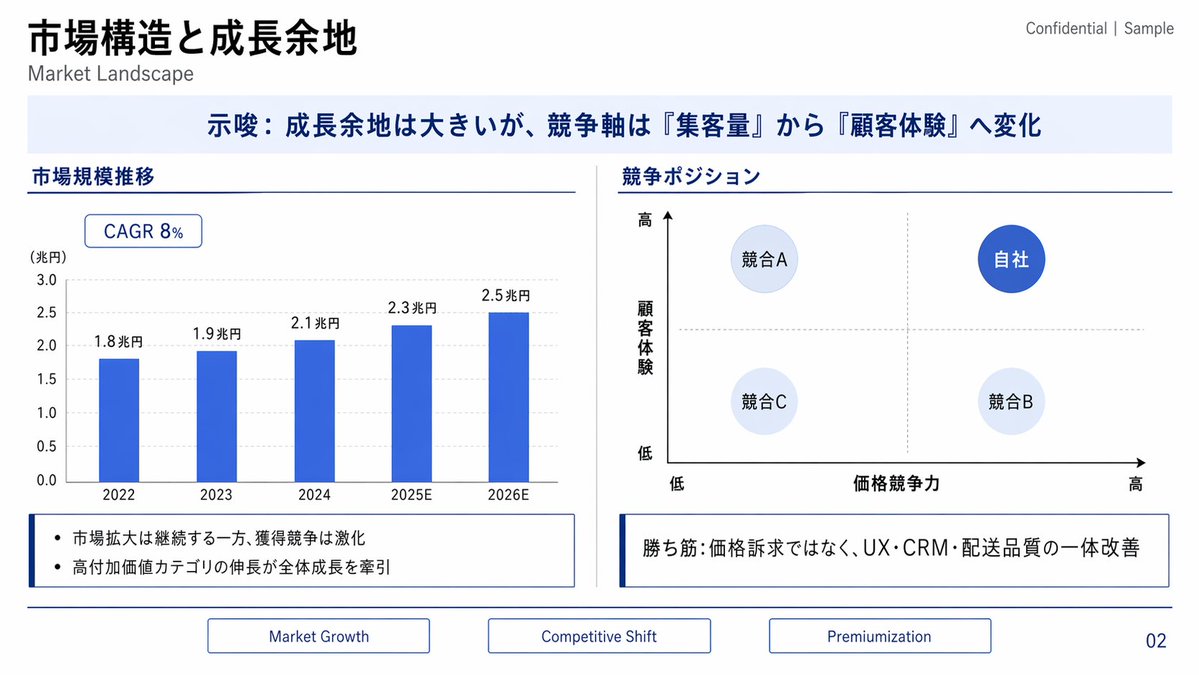
Infographic / Edu Visual - Japanese Market Landscape Slide
ต้นฉบับ2,889 อักขระ
{"type":"corporate consulting presentation slide","language":"Japanese with small English subtitles","format":"16:9 widescreen slide, clean white background, navy and royal blue business style","title":"{argument name=\"main title\" default=\"市場構造と成長余地\"}","subtitle":"Market Landscape","top_right_label":"Confidential | Sample","page_number":"02","theme":{"primary_color":"deep navy","accent_color":"royal blue","secondary_color":"pale blue","lines":"thin navy divider lines","typography":"modern sans-serif, bold Japanese headings, restrained consulting-deck style"},"layout":{"top":{"position":"upper left","content":"large bold Japanese title with smaller English subtitle underneath; confidentiality label at upper right"},"key_message_banner":{"position":"full width below title","background":"very pale blue rectangle","text":"{argument name=\"key message\" default=\"示唆:成長余地は大きいが、競争軸は『集客量』から『顧客体験』へ変化\"}","style":"centered bold navy Japanese text"},"main_content":{"columns":2,"divider":"thin vertical gray line between columns","left_section":{"title":"市場規模推移","type":"bar chart","position":"left half","chart_details":{"badge":"CAGR 8%","y_axis_label":"(兆円)","y_axis_range":"0.0 to 3.0","gridlines":"light gray dotted horizontal gridlines","bar_count":5,"bars":[{"year":"2022","value_label":"1.8兆円"},{"year":"2023","value_label":"1.9兆円"},{"year":"2024","value_label":"2.1兆円"},{"year":"2025E","value_label":"2.3兆円"},{"year":"2026E","value_label":"2.5兆円"}],"bar_style":"solid royal blue vertical bars"},"note_box":{"count":2,"bullets":["市場拡大は継続する一方、獲得競争は激化","高付加価値カテゴリの伸長が全体成長を牽引"],"style":"outlined white box with navy left accent line"}},"right_section":{"title":"競争ポジション","type":"2x2 positioning matrix","position":"right half","matrix_details":{"x_axis":"価格競争力","x_axis_left":"低","x_axis_right":"高","y_axis":"顧客体験","y_axis_bottom":"低","y_axis_top":"高","axis_arrows":"black arrows pointing right and upward","crosshair":"light gray dotted vertical and horizontal midpoint lines","bubble_count":4,"bubbles":[{"label":"競合A","position":"upper left","style":"pale blue circle"},{"label":"自社","position":"upper right","style":"dark royal blue circle with white text"},{"label":"競合C","position":"lower left","style":"very pale blue circle"},{"label":"競合B","position":"lower right","style":"very pale blue circle"}]},"note_box":{"text":"{argument name=\"right insight text\" default=\"勝ち筋:価格訴求ではなく、UX・CRM・配送品質の一体改善\"}","style":"outlined white box with navy left accent line"}}},"bottom_navigation":{"position":"bottom center","tab_count":3,"tabs":["Market Growth","Competitive Shift","Premiumization"],"style":"three thin outlined rectangular tabs in navy, evenly spaced"}},"composition":"precise slide grid, generous margins, horizontal navy rules separating header/content/footer, polished strategy-consulting PowerPoint aesthetic, no photos or illustrations, sharp vector graphics"}